|
Introduction Here's a quick recap of why tides Tides rise and fall and also flow along our coast. We will deal with these as separate items, but first why do we have tides at all? Is the Earth breathing or maybe it’s on a slope? Maybe not? Read on. Gravity is the force, which produces the tidal effect. Not the Earth’s gravity, but the gravitational pull of both the Moon and to a lesser extent the Sun. |
 |
 |
Everything on Earth is subject to the Moon’s gravitational effect, but most objects are fixed or solid and cannot move or be sucked toward the Moon. Maybe the great brains will get together when our fossil fuel runs out, to see if they can harness this incredible natural power that can effortlessly drag all the waters of the English Channel, zillions of gallons, on average about twelve miles and it does this twice every day! Pretty impressive if you ask me.
The seaman can use this force, or not, but one thing is certain, he can do nothing about it!
What happens?
As the Moon orbits the Earth, its gravity sucks water towards the Moon. This creates a rise in the water level under the Moon. Tidal rise.
The Moon is on the move and we are spinning around, so this lump of higher water gets pulled around the Earth. Tidal flow.
This is a simple way of understanding what happens.
The Moon orbits the Earth about every 28 days and we spin around once every 24 hours.
The tides I’m afraid do not happen quite that regularly. The Sun sticks its oar in and mucks up the pattern.
In northern Europe we get two high tides and two low tides every 24 hours (ish). The times of these high and low waters are constantly progressing, (high tide gets later every day). The time between high and low water averages out at a few minutes longer than six hours apart. The tides also constantly swing from Neaps to Springs and back, so the heights of these high and low tides are always changing too.
At a particular port, Spring and Neap high waters always occur at the same times.
For example, in Plymouth, Spring high waters are always around six a.m. and six p.m. Neap high waters are around lunchtime and midnight.
At Southampton though, Spring high waters are at lunch time and Midnight and Neaps are around six a.m. and 6 p.m.
The above is all very interesting, but all the seaman needs to know is how high is the tide, how fast is it going and where is it going?
There are a few terms that we need to revise first.
CHART DATUM is a very important level, It is sometimes known as LAT (Lowest astronomical tide) lots of other levels are measured from it: -
- Drying heights (Land which covers and uncovers with the tide)
- Charted depths or soundings, are measured below Chart Datum.
- All tidal levels (MHWS, MHWN, MLWS, MLWN and the Height of tide).
- MHWS . Mean High Water Springs
- MHWN . Mean High Water Neaps
- MLWS. Mean Low Water Springs
- MLWN. Mean Low Water Neaps
Tidal Range is the difference in height between a particular High and low water.
MHWS is an important level as all heights on land are measured from it. e.g. the height of a hill or a lighthouse.
We need to know the height of tide for various reasons. The yacht’s echo sounder or lead line tells us the total depth, but the chart shows us the depth below Chart Datum (CD). If we want to use the depth to help find our position on the chart, then we must reduce the measured depth by the height of tide.
Here is an example. Look at chart No2.
Imagine we are on a passage around Start Point for Dartmouth. It is a flat calm and we are motoring in a smooth sea with no swell and our craft draws 1 metre.
The direct line between Start point and Dartmouth takes us dangerously close to the drying "Skerries Bank". However if it happens to be MHWS at the time, there would be 4.2 metres of water over the shallowest area.
We work this out as follows
First see Tidal Levels table on the chart.
Start Point, (very close to the Skerries), has a tidal height above Chart Datum of 5.3m at MHWS.
The Skerries dries 1.1 metre above Chart Datum,
so take 1.1 from 5.3 = 4.2 metres
We can take the direct line in safety, with a clearance under our boat of 3.2m. (Don’t forget we draw one metre.)
If we are entering a harbour which dries out at low water, then the height of tide is crucial for obvious reasons.
Exercise 10 See tips for RYA Ex 2 c and d
There are two main ways of finding out the height of tide for a given time and place, the "Tidal Curve" method and the "Rule of twelfths" method
| Over many years, tidal data is
collected at ports and this goes to produce tidal curves. The tides,
although the times and heights differ, follow a pattern, which only
changes minutely. Because we have this base to work from (the curve) all
we need to do on a daily basis is to find out the times and heights of
high water (HW) and low water (LW) and apply them to the curve.
Here’s how. For example let’s look at St Peter Port on Thursday 2nd May (Practice Navigation Tables - PNT). We want to find out the height of tide at 0824BST.(British Summer Time) First we look in the Almanac (we will be using the PNT during this course) to find the times and heights of high and low water on the 2nd May. Page 39. HW St Peter Port is at 0534 UT (GMT) and the height of the tide is 8.7 metres. LW St Peter Port is at 1159 UT (GMT) and the height of the tide is 1.5 metres. Take the HW height from the LW height. This will give you the RANGE of tide. Range is the difference between high and low water. On 2nd
May the Range is 7.2m. |
|
| Look at the tidal curve on page 38 PNT and you can see
this to the right
of the curve.
So we are closer to a spring tide than a neap. This means when we come to use the curve, we must use the bold curve rather than the pecked one. Do not interpolate between the pecked and bold lines on the curve. If you need more accuracy then take both spring and neap heights or times from the curve. then interpolate them using the range for the day. |
 |
You will notice that the times in the Almanac are always given in Standard time. For the UK that is UT (GMT). In France it would be French standard time. Look to the top left of page 39 under zonetime and you will see what to do.
In a real almanac, you would have tide times and heights for the whole year and some would be shaded in. See Plymouth page 23.
UT means Universal time and is a new way of saying GMT.
Forgetting to deal with French standard time, and British summer time are very common and make a huge difference to your tidal height and tidal stream calculations!
| So add an hour to the High water time to turn it into BST. (The time your watch would say at that time of the year) |  |
HW 0634 BST 8.7m LW 1.5m
Apply these numbers to the curve as shown below. Then join the two
heights with a line across the graph. Use a sharp
pencil, preferably a 2B. They are clear and rub out easily.
Be as accurate as possible.
|
Ok, so now to find
the height of tide at 0724BST.
Mark in the hours after HW, Bottom right. 0634 0734 etc 1, Follow the line going up onto the curve from + 0150h 2, Where it cuts the spring curve, using a straight edge, go across to the pencilled in line. 3, Go up or down to read off the height of tide for 0724BST. Answer 6.6 metres
|
NB some ports use LW time instead of HW (see end of Secondary ports section)
Exercises 11
| CRUCIAL STUFF! |
|
This is an old method, which assumes that the tide comes in and goes out at the same rate. This means that the tidal curve will be roughly symmetrical. It does not always do this of course! NB; see tidal curves on page 62 PNT. Pretty strange tidal curves there! I will talk about them in a minute. Also this method assumes a six-hour tidal duration from HW to LW. You know this is also not correct.
However as a quick, easy method when the tidal curve is roughly symmetrical, it is adequate.
Here’s how.
All you do is find out the Range. (Take LW height from the HW height)
Divide the range by twelve.
See the table below to see how many twelfths of the range move for each hour.
| 1st hour | 1/12 |
| 2nd hour | 2/12 |
| 3rd hour | 3/12 |
| 4th hour | 3/12 |
| 5th hour | 2/12 |
| 6th hour | 1/12 |
We will now work through an example of the method used to find the height of tide using the rule of twelfths. For simplicity use the same day as for the curve method.
St Peterport HW 0634 BST 8.7m LW 1.5m
Range 8.7 minus 1.5 = 7.2m
Divide 7.2 by 12 = 0.6 one twelfth is 0.6m
Find the height of tide for 0834 BST.
Over the 1st hour after HW we lost 1/12. Over the 2nd hour after HW we lost 2/12.
3/12 = 1.8m. Take 1.8m from the high water height and we have 6.9m
I’m afraid there are lots of errors and they affect both methods.
Blow water around, so they can blow water out of the harbour and therefore reduce the LW height and hold down the HW height. Or they can blow water in, holding up the LW height and increasing the HW height.
This effect can be very important. Changing heights by metres not centimetres!
Heavy rainfall
Particularly in rivers, the amount of rain water can affect the height of tide considerably
Can also affect tidal heights. High air pressure "pressing down" on the sea will hold down HW and lower LW. Low Pressure "sucking up" on the sea will give a higher HW and higher LW.
If the above factors happen to stack up on one side, there can be a major difference in the height of tide. eg. With a high pressure system sitting over UK and a Low over France. Strong easterly winds hold back the flood tide in the English channel and therefore reduce the tabulated height prediction. This high pressure is also pushing down and stopping the tide flooding. Highs also tend to give fair weather so no rain water in the rivers. All this will reduce the height of tide.
If however we have a low pressure system in the south west approaches to the UK. Lots of strong SW wind blows the water up the channel (raising the level) Low pressure allows the the tide to flood and we would also expect heavy rainfall which also raises levels. If this situation occurs at spring tides, we can expect flooding.
These errors, which are not allowed for in the methods above, are very difficult to calculate. So always leave yourself some room for error. They are however not the biggest cause of tidal height problems for the yachtsman.
No the biggest cause is...
- The wrong day!
- UT and BST mix-ups.
- Using LW time instead of HW.
- Misunderstanding the scale on the tidal curve.
- Blunt pencils!
- Not using a straight edge.
- Changes in chart datum in short steep rivers.
Some of these errors are only tiny, but if they all happen to stack up together, they can be significant.
Changes in chart datum
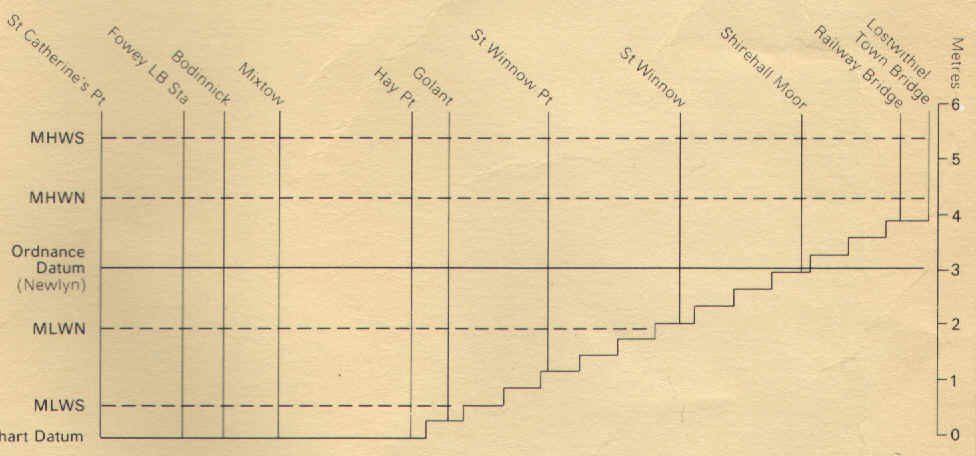 A
few words about the changes to chart datum. Where you find short steep tidal
rivers, eg Fowey, Dartmouth, Truro etc. There are often little insets on the
chart like this one.
A
few words about the changes to chart datum. Where you find short steep tidal
rivers, eg Fowey, Dartmouth, Truro etc. There are often little insets on the
chart like this one.
The simple way of understanding this is to think about the charts colours. As
you know, where the blue meets the green is chart datum. At lowest astronomic
tide, it is just dry at that point. The rub is that although it is low tide at
Fowey, there is still fresh water coming down the river and at lostwithiel it is
not completely dry because of this water. There is water at Lostwithiel, but to
have any rise of tide there we must have a height of tide at Fowey of almost
four meters. The green meets the blue all the way up the river, but it is not
the same level. Chart datum changes and you must use the table!
I can feel you all saying oh no not these again! Its not that bad, come on.
Secondary ports are small ports which do not have their own tide tables or
curve in the almanac. Standard Ports have their own tidal curves and tide tables
in an Almanac. The Almanacs are very thick books with about one thousand pages!
If all ports also had tide tables and curves, then the book would be unusable.
(I don’t think I could lift it!)
Secondary ports use the curves of a standard port. This Standard port is usually but not always close to the secondary port. More importantly, the Standard port curve is very similar to that of the Secondary port.
Finding the times and heights of high and low water at a secondary port is a little bit tricky. Let’s look at Sark (Maseline Pier). Page 40 PNT. Sark does not have its own tide tables or curve. It uses standard port St Helier.
| The high and low water times in the red box are for St Helier and are in UT. (All times written in the Almanac will be in Standard time, not necessarily UT). |  |
You can see that if, for example, there is a HW time at St Helier of 0300 UT, then there will be a difference of 5mins to be added for Sark (Underneath +0005). If there were a HW of 0900 UT then there would be a difference of 15 minutes to be added for Sark.
Likewise if there was a HW height at St Helier of 11meters. Then there would be a difference of 2.1 meters to be deducted for Sark. A LW of 1.4 meters at St Helier would give us a difference of 0.3 to be deducted for Sark.
Easy enough so far?
Don’t get too worked up about Secondary port differences! They are a very small part of a skipper’s lot. Many secondary ports have tiny differences that really are not worth worrying about, but let’s try an example for a port where working them out is important for safety.
What are the times and heights of high and low water at Sark on May 3rd 0700BST onwards?
First we must find Sark in our Almanac (PNT) page 40. Under tides, it tells us that the Standard port is St Helier and to go on in the book to find St Helier (the arrow)
Reaching the St Helier tide table on page 42, extract the information for 3rd May.
HW 0613 10.8m and LW 1256 1.2m
Back to the Sark page (40) - it gets a bit tricky now!
To find the high water time is easy if it is 0300, 0900, 1500, or 2100.
The problem is that we have 0613. Let’s call that 0600 UT for clarity this
time. 0600 is exactly half way between 0300 and 0900, so we apply +0010, exactly
half way between +0005 and +0015.
Sark HW time is 0623 UT
To find the Low water time. LW St Helier is 1256 UT. Let’s call that
1300UT 1300 is between 0900 and 1400. This is a bit more tricky.
Luckily there are 5 hours between 0900 and 1400 and there are five minutes between + 0005 and +0010 (underneath). Using "Interpolation" - there’s a good word; it means to estimate values from known ones in the same range - we can see that for every hour after 0900, the difference becomes one minute less;
|
0900 |
1000 |
1100 |
1200 |
1300 |
1400 |
|
+0010 |
+0009 |
+0008 |
+0007 |
+0006 |
+0005 |
So the LW water time for Sark is 1256 + 0006 = 1302 UT
 Now
to find the height of High Water.
Now
to find the height of High Water.
HW at St Helier is 10.8m.
Again, it gets a bit more tricky.
We use the same method as with the times, but the numbers don’t fit so
easily this time. In reality I would say that 10.8m is very close to 11m (MHWS)
and would therefore take away 2.1m. However, this is how to work it out.
| The easiest way is by simply drawing a graph. I use graphs
or pictures whenever I can at sea, because they are easy to understand.
When I have been up all night slogging over the Channel, I’m tired and
my tired brain can understand a picture, but it gets confused with
numbers. At sea cheating is allowed! The right answer is all that
matters, not how you get it.
This graph will work for each time that you need to work out a height of HW at Sark, so once you have made it there is no more maths! Just slide up to the diagonal line with your St Helier Height (e.g. 10.8) Then straight over to the Sark height difference. |
 |
It would be better to use graph paper, but I never seem to have any aboard. Just draw the graph large enough to give good accuracy. This one is only just large enough.
The HW height at Sark is 10.8 – 2.1 = 8.7m
According to my graph we should be taking off 2.06m, but that’s getting a bit ridiculous!
 Now the LW Height at Sark
Again I could just say that 1.2m is very close to 1.4m the MLWS height and therefore take off 0.3m.
| But we will have a look at a little more accuracy by
drawing a simple graph. Again, whatever LW height at St Helier we
have in the future, we can simply apply it to the graph.
So the LW height at Sark will be 1.2m – 0.3= 0.9m
|
|
| St Helier Tides for the 3rd May | HW time = 0613 UT, height = 10.8 m LW time = 1256 UT, height = 1.2 m |
| Sark Tides for 3rd May | HW time = 0623 UT, height = 8.7m LW time = 1302 UT, height = 0.9m |
Because it is May, we will need to add one hour to these times before we can use them on St Heliers tidal curve. So the HW time to use is 0723 BST
Exercise 14Now have a quick look at page 62 PNT. Pretty strange tidal curves!?
The shape of the Isle of Wight makes the tide give two high waters in six hours rather than one. To my knowledge it’s the only place where this occurs. If you are going to sail out of the Solent then you need to know about them.
Have a look at the Lymington curve (the middle one) At –6 hours and –4 hours, you can see the double high water. The LW time is regular, so use the Low water time instead of High water for height calculations on the curves.
Be careful with these curves. They are very small and therefore it is difficult to be accurate.
There is another way of finding out all the above information and that is
to use a computer programme! There are quite a few around these days and they
claim to be very accurate.
My advice on this would be to get good at the steam driven methods above then
use a computer if necessary to save time. Personally I feel uncomfortable
pressing buttons, but perhaps there is some advantage in it because there are
so many human errors as I have mentioned. A computer doesn't make them.
To summarise, there are two main ways of finding out the height of tide for a given time and place:- the "Tidal Curve" method and the "Rule of Twelfths" method. If you need accuracy use the curves.
We need to know the height of tide for various reasons.
As you know, the chart gives depths below Chart Datum, but it is rare that the tide gets down that far. If we want to use the depth to help find our position on the chart, then we must reduce the measured depth by the height of tide to find out the charted depth. This technique is particularly useful when the fog comes down and don't forget that the tide height will change appreciably (you can measure it on the curves) every ten minutes in the third and fourth hour or where you have very large ranges .
Tips
A few tips for working out depth to anchor in, clearance under bridges
and
dry out / float off times
These are all easier if you use a picture to help you.
WORKING OUT DEPTH TO ANCHOR IN
Apart from normal considerations like "is the seabed suitable?" " Are we allowed to anchor there?" "Is it safe to anchor here considering the forecast weather?" There is the obvious one
"When the tide goes out, will I still be afloat!
To find the minimum depth to anchor in.
1, Find out the height of tide on your arrival.
2, Find out the fall of tide from then to LW.
3, Add together your boat’s draught, clearance and fall of tide. This gives
you the minimum depth to anchor in.
Draught is the depth from the waterline to the bottom of your boat.
Clearance. You decide on a safe "clearance" between the bottom
of the boat and the seabed depending on lots of factors.
Is the sea floor regular? E.g. are there under water obstructions sticking up?
(Wrecks, rocks, Supermarket trolleys! mooring blocks etc)
Is the sea floor shallowing towards the shore?
If the wind shifts, might you swing into shallower water?
Here is an example.
A yacht drawing 2m is anchoring in Cawsand Bay, Plymouth Sound on 19th February 1820 UT. The skipper decides that the ground is Fine sand and reasonably flat, but because of sewer outfalls coming out from the shore that he cannot see (it’s already dark). He decides on a 2m clearance.
Look at the Tide table on Page 23 PNT. 19th Feb HW 1820 5.5m and the next LW on the 20th 0.2m
Luckily it is HW on arrival. 5.5m The fall will be 5.5 – 0.2 = 5.3m
Clearance 2m. + Draught 2m + Fall 5.3m = 9.3m depth to anchor in.
NB fine sand is not a particularly good anchoring medium. Anchors tend to pull through it. Sand or course sand is much better FS, S or CS
Exercise 12CLEARANCE UNDER BRIDGES OR OVERHEAD CABLES
Sometimes it is necessary to pass under a bridge and this is how to calculate whether you can pass under. Heights as I have said before are measured on the chart form MHWS. Not chart datum.
Have a look at the cable with a clearance of 28m half a mile East of Kingsbridge on chart 2. (50º 16.8’N 004º 45.4’W) So you know what a cable clearance looks like.
 To work out if you can pass under such a cable you need to know the air
draft of your boat, the MHWS height in that area and the height of
tide for the time you want to pass.
To work out if you can pass under such a cable you need to know the air
draft of your boat, the MHWS height in that area and the height of
tide for the time you want to pass.
Normally you have more clearance than is given because the tide is usually not as high as MHWS.
Take the height of tide from the MHWS height. Then add the answer to the bridge clearance from the chart. Compare it to the air draught of your boat to see if you will clear.
Remember that the air draught of your vessel may alter when you are heavily
loaded, when you fit extra masthead equipment like aerials, or if your boat is
floating in different kinds of water! Mediterranean seawater is more salty than
the Atlantic and therefore more dense. Your boat will float higher in the Med.
Fresh water is less dense so your boat will float deeper in fresh water. So give
yourself a clearance.
Oh, it always looks a lot closer than it really ! Every time I go under a
cable, even when I know it is 10 meters above my mast, I still get nervous! It
is very difficult to judge the gap by eye from the deck.
WHEN WILL WE GROUND OR FLOAT?
You will need to dry out your boat for various reasons and sometimes you will run her aground I’m afraid. It is no big problem in some circumstances. E.g. slowly and carefully exploring a muddy creek.
When this happens, note the time because you will need to find out the height of tide for that time. The next time you get the same height of tide, the boat will float.
Echo sounders
Before I close on getting close to the bottom! I think we had better have
a few words about these.
The best, of course, are bits of string with weights on the end!. Lead lines. When
dangled over the side they never lie to you! However they are a bit slow and
it's a
bit tricky when in mid channel with 70 meters underneath you!?
Electrical echo sounders use timed sound waves bounced back from the bottom
to measure the depth. They are a great tool, but must be treated with
caution.
A few things to look out for are:-
- How far under the water is the transducer? and have you set the offset accordingly.
- Are you heeling over and is the sounder therefore showing you more water than there really is. (Sound waves go straight out the bottom of the transducer, not straight down from the boat.
- A muddy bottom does not give a good echo. The sound wave may be lost in the mud.
- Good yacht echo sounders only read reliably down to about one hundred metres.
- Turbulence causes air bubbles and this greatly affects the sounder's reliability.
- You may still come across old "rotating dial" sounders. They have two scales which you will have to set manually (shallow or deep) Be careful with these echo sounders as they will occasionally give second trace echoes. These are extra flashes on the screen which you must remove either by changing the range or turning up the gain. These machines are old hat these days and I haven't seen one for ten years at least!
Around the British Isles, the tidal stream floods from the Atlantic, north up the West Coast and east up the English Channel to the Thames Estuary. The Ebb tide does the reverse. The flood is the rising tide and the ebb is falling.
The speed of this tide varies greatly, but at times in certain areas can reach speeds of 8 knots. These areas are quite rare, but the average speed is probably a couple of knots.
If your boat is sailing at 5 knots it is well worth using the tide as it represents either 40% extra speed or 40% less!
There are four ways of finding out the direction and rate of the tidal stream.
- "We can see it" running past buoys, beacons and anything else moored in the water. We can therefore judge its direction with our compass and its speed by our speed log. (When you are stationary at a buoy, pointing into the oncoming tide, your log will be telling you the speed of the tidal flow.
- We can use "Tidal Diamonds" that are dotted around charts in
strategic places and refer to a table also on your chart. There are also
tidal arrows shown in fast tide areas, with numbers next to them in knots.
Be careful when using both these methods. The information is only correct at
the exact location. Using the closest diamond is not always a good idea
(For the purpose of this course always use the diamond given in the question)
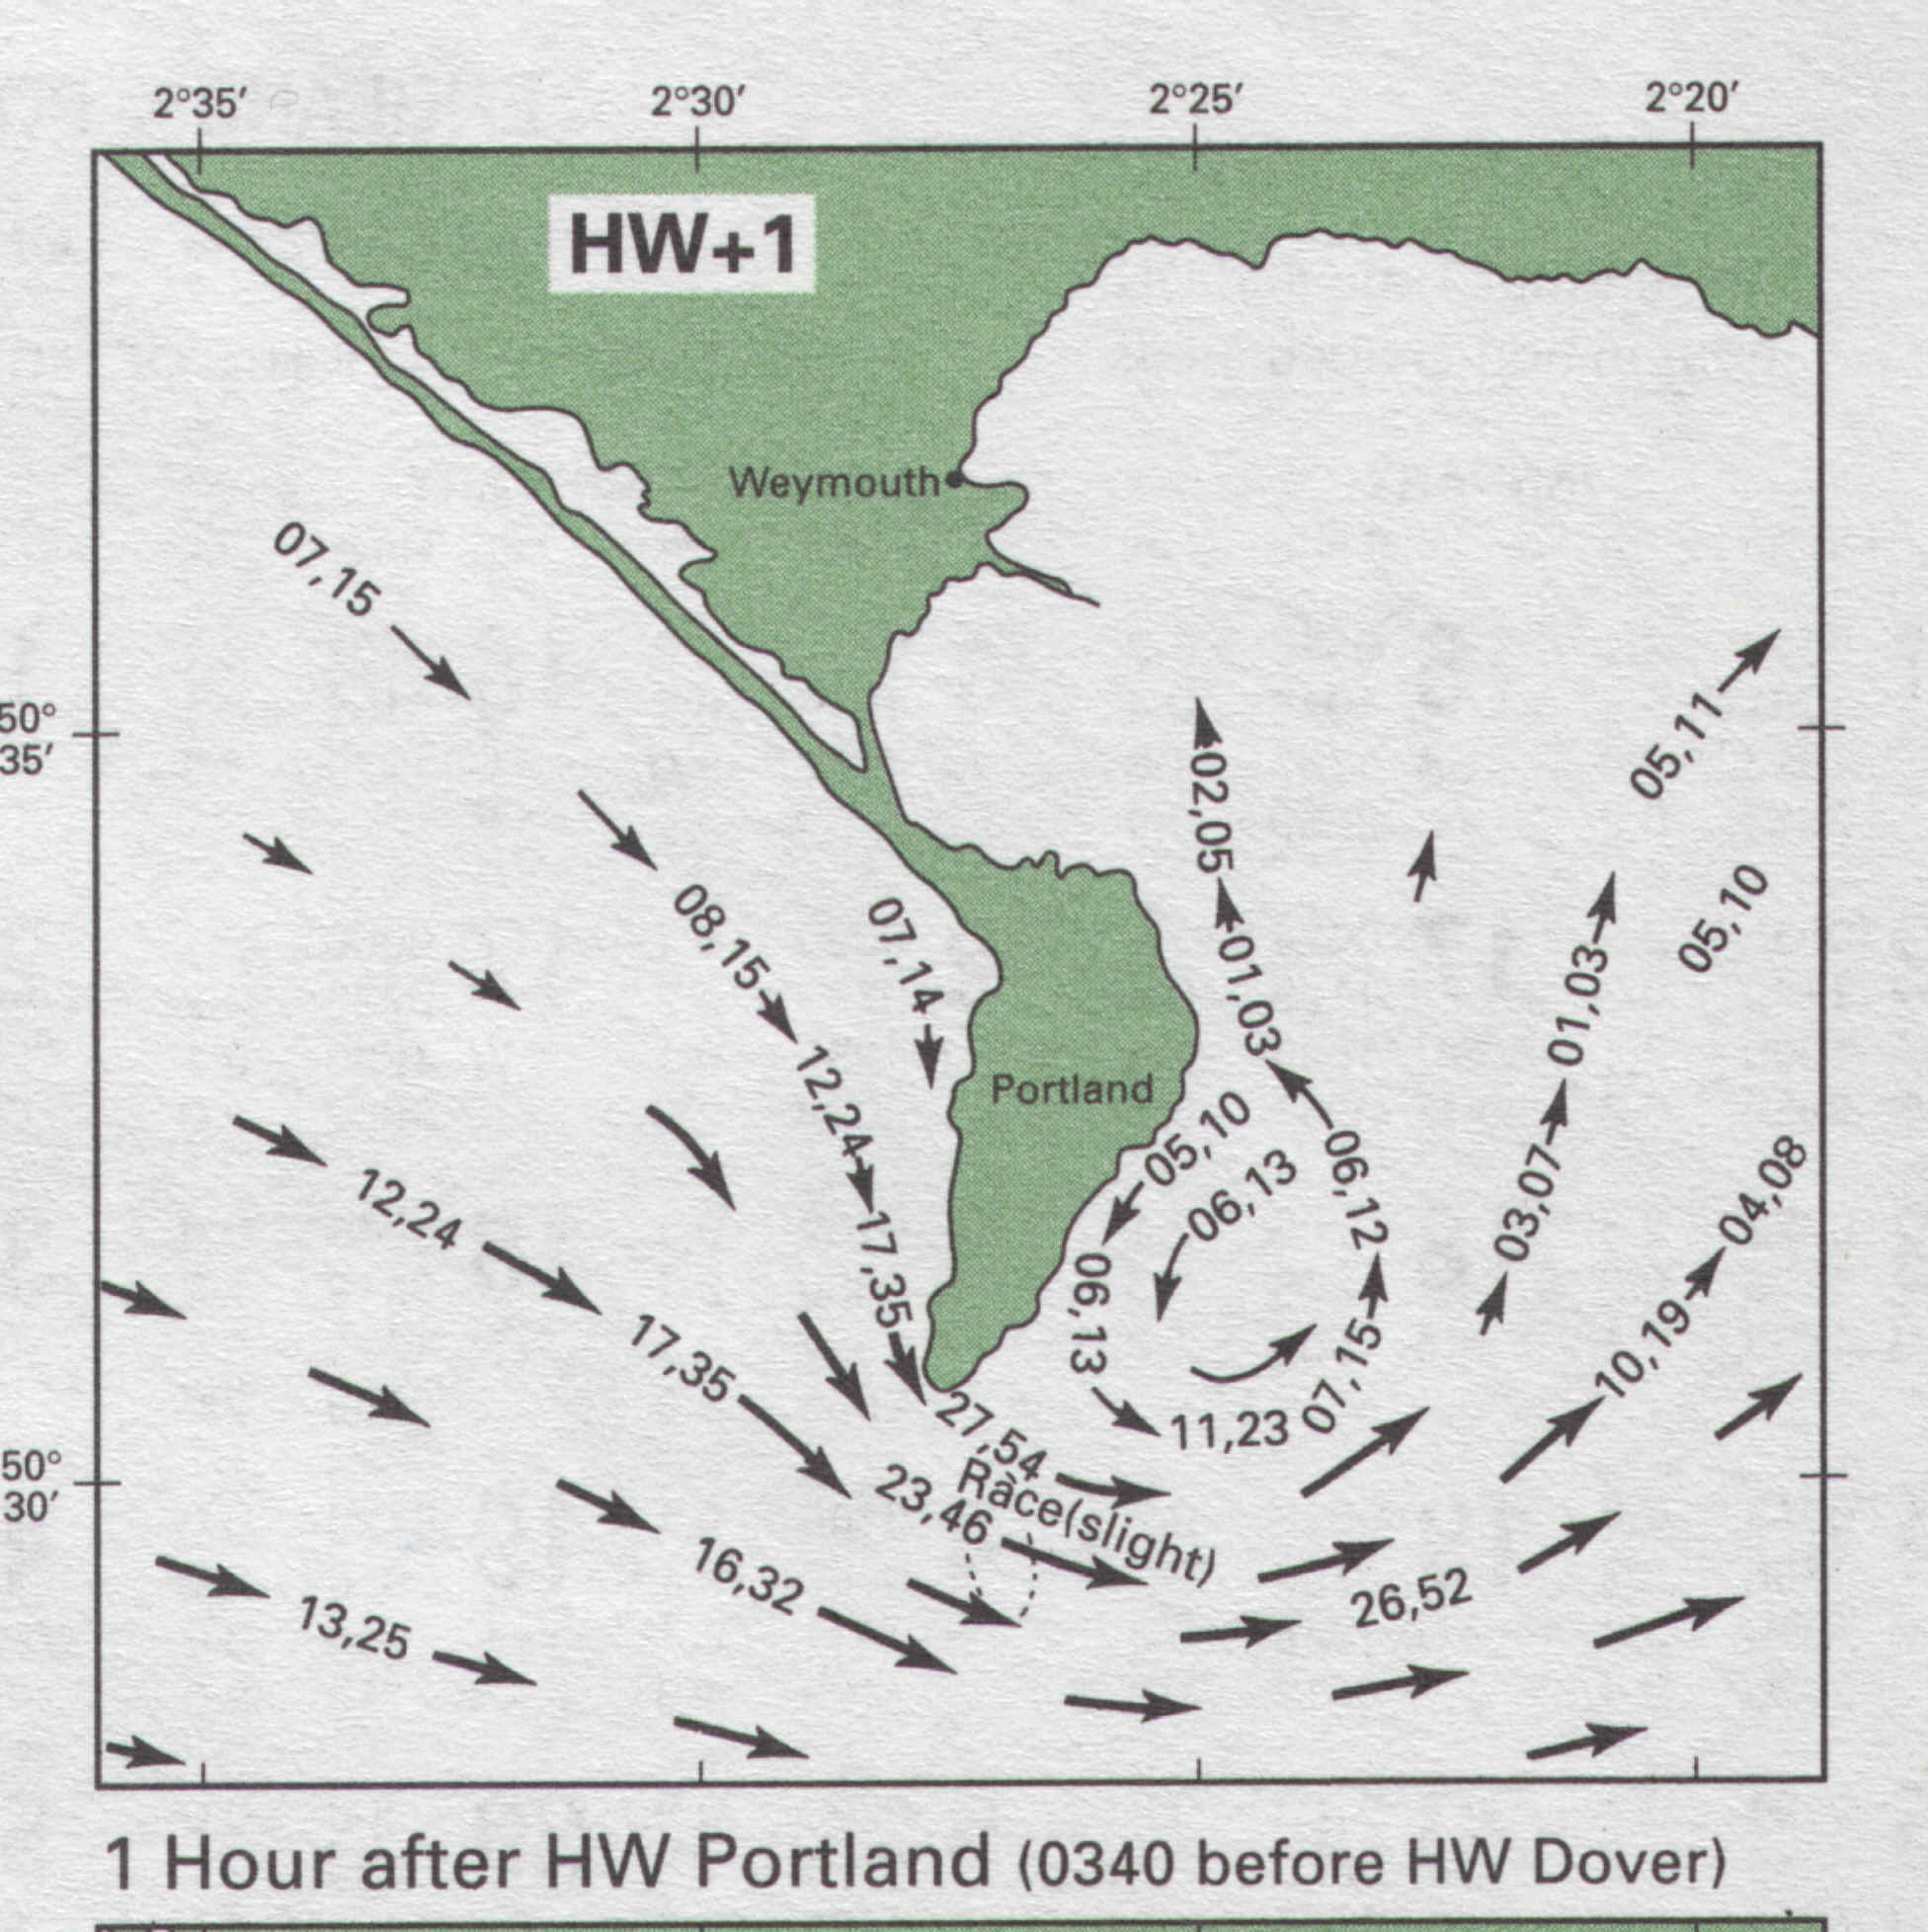
- We can use "Admiralty (and others) Tidal Stream Atlases" These are books with pictures of the tidal flow, shown hour by hour through the tidal cycle.
- We can look up in Pilot books and or Almanacs in the passage information sections. If you want to know the exact time at which the tide starts its flood in the Alderney race, you will find it on page 34 in the practice nav tables. Leave me a minute and have a good look.
Using the visual method is part of the practical course and not dealt with here.
Have a look at chart 2 and I will guide you through the use of a diamond.
In the channel between North and South Coombe Islands, you will see a Magenta Diamond with "F" in it. Over on the left of the chart, you will see a table headed "Tidal streams referred to HW at Plymouth."
On July 1st we have anchored to effect repairs to our yacht’s engine, close to shore on the East side of Boat Island (off South Coombe Island). We have been unsuccessful in repairing the engine. With no wind the best we have been able to do is to lash our dinghy alongside and we plan to use our small 2-hp outboard motor to push us back to Dartmouth. We can make 2 knots with this rig.
When can we pass through the Channel between the Islands?
Diamond "F" and the table can give us the answer, but first we must find out the time of HW at Plymouth and the Range.
HW Plymouth is at 1754 UT 5.5m and LW is 0.6m. The range is therefore 4.9m
It is summer time so we must add an hour to the HW time.
HW 1854 BST Range 4.9m
The range tells us that we are close to a Spring tide (see Mean ranges, next to the Tidal curve on page 25). If the range is midway between Springs and Neaps, we take half way between the Spring and Neap RATE
For this example we use the Spring rate.
| 1854 is only a moment in time, but the 057°
1.0 or 0.5 tide runs for one hour.
1854 is the middle of that hour. The tide starts to head 057° at 1824 and changes to 074 at 1924. |
 |
| Because the table is very small, it is a good idea to
write out the table and times like this.
It is very easy to make a mistake otherwise. It is obvious that for example 250º 1.8 (–2) starts at 1624 and finishes at 1724.
|
 |
Back to when should we pass through the channel?
I would aim to be in the middle of the Coombe channel by 1654. The tide is slowing from its fastest rate, but still making 1.8 knots (almost doubling our speed) Then once we have cleared the channel, we pick up a NE going tide to help us up to Dartmouth. (see diamond D, –1 and the HW hours)
Very often when working out tidal stream, you will not want to use a whole
hour of tide.
For example let us assume that we want to know the rate and direction between
1730 and 1900
That is one and a half hours. So we would take 296º 0.5 (-1 before HW) and
057º 1.0 (HW hour) BUT we only use half of the rate of the HW hour (0.5
knots) because we are only using half the hour.
Computation of rates table
Have a look at the inside cover of the Practice Nav table. There you will see an example of a computation of rates table.
It is used to compute the tidal stream when the range is not close to the mean spring or mean neap ranges (most of the time). If you find that the range of tide is half way between springs and neaps, then just use the mid point between the two given rates in the atlas. However if as is usually the case, you have some other range, then use the table below. it is much easier than maths!
It is very simple to use. Use the RANGE of tide at the reference port (in the above example 4.9m) and use the two tidal rates (mean spring and mean neap) as shown to find an accurate rate of tide in knots.
Exercise 16
USING TIDAL ATLASES
Turn to page 6, 7, 8, and 9 PNT
These are tidal stream charts giving an overview in picture form for a large area. They are very useful when passage planning or, in the case of the charts on page 9 PNT, for navigation around small areas with large tidal streams. Diamonds are very accurate, but only for an exact location. NB these charts are for practice only. In reality each chart would cover a whole A4 page. There are "Admiralty Tidal Stream Atlases" for all our coastal waters and they are also reproduced under licence in the various Yachtsman’s Almanacs.
The rules for using both the Diamond method and these are the same. There is always a reference using HW at a certain port (Usually Dover in reality). We still need to split the hour of HW into two half-hours, one either side of the HW time.
Just write them in under each hour’s box, BUT don’t forget to rub them out afterwards, or you will use the wrong times on the wrong day!
Consider; is it summer time or not!
Consider; is it a Spring tide, Neap, half way between or well over a spring if
there's a big range.
Or halfway between? The computation of rates table makes life much easier here.
As you can see, it is possible to plot your rough position onto a tidal chartlet (Latitude and Longitude scales). Then decide which arrow or part of an arrow (if it has a curve in it) to use.
 You can take the bearing of the tidal stream from the arrow using your Breton
Plotter. Be careful here though because the atlas may not give the correct
bearing of the tide if you are close inshore or in a bay. Tidal atlases in the
main give information on the tide off shore and do not show back eddy's around
headlands etc. Where there are big tidal steam problems, eg Portland bill, the
Alderney race etc, there are normally separate atlases to cover these areas
You can take the bearing of the tidal stream from the arrow using your Breton
Plotter. Be careful here though because the atlas may not give the correct
bearing of the tide if you are close inshore or in a bay. Tidal atlases in the
main give information on the tide off shore and do not show back eddy's around
headlands etc. Where there are big tidal steam problems, eg Portland bill, the
Alderney race etc, there are normally separate atlases to cover these areas
While looking at the Tidal Atlas, notice that the tide runs fastest around headlands and between Islands or Islands and the mainland. (Look at Alderney and mainland France) These are Venturi effects and need special consideration. Have a quick look at chart 1 in the same place. You can see "Heavy Overfalls" and symbols depicting waves.
The tide is being compressed into a small gap between two pieces of land and is going over shallows. If the wind is against the tide, this is a very dangerous place for the small boat. Passage planning, to be in the right place at the right time is crucial. Stability
We have learned a lot here and it will all be very helpful at sea, but be careful. The tide is not always what it seems and certainly does not always do what is tabulated. Get some experience and look at the shape of the land if you are close to it. This will often give you a hint of the general direction of tides. Always assume that you have got the tide wrong and therefore leave some room for error.